

Empirical evidence: Momentum investing beats the market
Gray (2014) conducted a simulation study on the performance of cheap and expensive stocks based on various valuation metrics. For testing purposes, he created 2 samples. The first sample was from 1927 to 1962 and the second sample was from 1963 to 2013. The samples were selected in a way that we can compare the results of the momentum simulations to the value simulations, which run from 1963 to 2013. He sorted stocks into deciles based on stock performance over the previous 12-month ranking-period returns (months t-12 through t-2, skipping the first month). He only focused on US mid/large cap to avoid weird micro/small cap outlier effects.
- Example: If there are 1000 stocks in the universe, stocks 1-100 go in the first decile (High mom/winners), stocks 901-1000 go in the tenth decile (Low mom/losers), and the stocks in between 101 and 900 go in their respective deciles.
Next, each month he drew a random 30 stock portfolio drawn from either the “winners” decile or the “losers” decile.
- Example: He draw 30 random stocks each month from the top (winners) and bottom (losers) decile from 1927 to 1962. Just, image he has a monkey throwing 30 darts, every month during the 36 year period, to establish, in each month, a new 30 stock portfolio. Once monkey has thrown his 30 darts in each month, he will then have 432 separate monthly portfolios (12 months * 36 years) and will have made 12,960 (30 stocks * 432 months) individual stock picks. This represents one simulation.
He conducted 1000 simulations for the top (winners) decile and 1000 simulations for the lowest (losers) decile as described above. He then calculated the performance statistics for each simulated strategy over the designated time period (e.g. 1927 to 1962). Each simulated strategy represents the returns a high-mom-investing monkey (past-winner buyer) or low-mom-investing monkey (past-losers buyer) would achieve over the sample time period analyzed. He estimated compound annual growth rates (CAGR), standard deviation, and maximum drawdown. For quick reference, I have compiled the results in the charts/tables below.
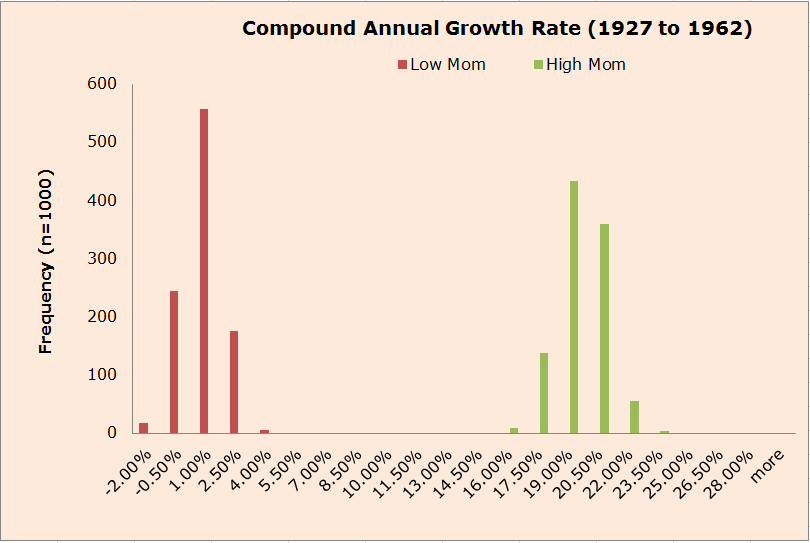
What Do the Returns to Winners and Losers Look Like?
First, let’s look at the distribution of CAGRs. The high mom portfolios generate much higher returns than the low mom, almost 20% higher on average. Clearly, buying winner stocks has generated strong performance and buying losers has been a sucker’s bet.
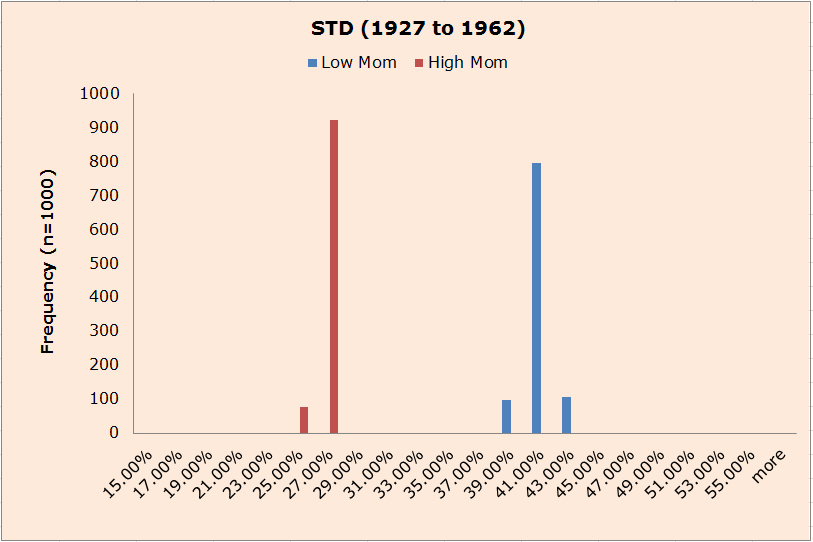
Historically, high mom beats low mom on a CAGR basis–no doubt. How about the Risks?
Let’s look at standard deviations of the portfolios formed with randomly selected samples from higher (momentum based) and lower (value based) decile. First, you’ll notice that standard deviations are tightly bound, even across 1000 simulations. No matter how you cut it, holding baskets of high mom stocks means less volatility. Low momentum stocks exhibit incredible volatility.
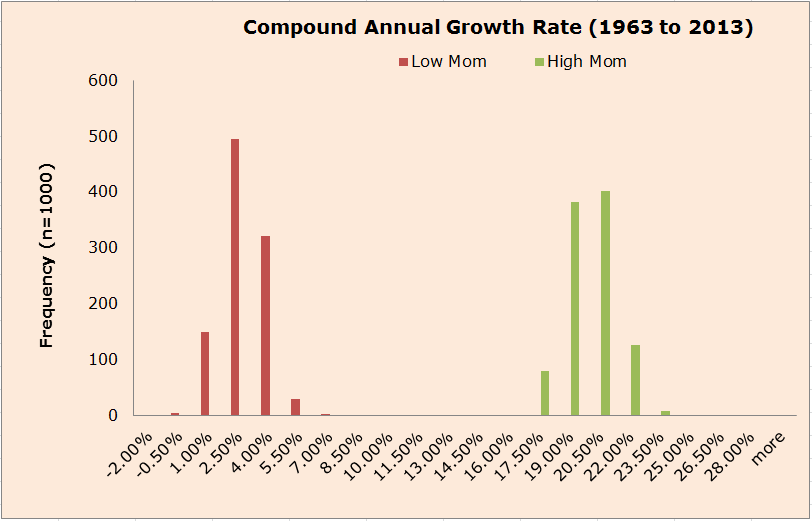
What are the Results over a Different Time Period?
From the 1927 to 1962 (36 years) period we get a clear picture that past winners keep winning and past losers keep losing. He conducted the same simulation analysis from 1963 to 2013 (50 years). The results are broadly consistent. Similar CAGR distributions: High mom stocks are the obvious winners.
High mom still has relatively lower Standard deviation, but volatility has converged.

My critique on momentum investment strategy
Applying and benefitting from momentum investment strategy in a real field is very challenging. Many other researches also showed that simulated portfolios that put a theoretical momentum investing strategy to work actually “add remarkable value, in most time periods and in most asset classes.” However, when used in a real-world scenario, the results are poor because of trading costs. Rob Arnott (2019), chairman, and founder of Research Affiliates researched on this strategy and found that “No U.S. mutual fund with ‘momentum’ in its name has, since its inception, outperformed their benchmark net of fees and expenses.” All of that buying and selling stirs up a lot of brokerage and commission fees. Traders who adhere to a momentum strategy need to be at the switch, and ready to buy and sell at all times. Profits build over months, not years. This is in contrast to simple buy-and-hold strategies that take a set it-and-forget it approach.
Despite some of its shortcomings, momentum investing has its appeal. For example, that “The MSCI World Momentum Index has averaged annual gains of 7.3% over the past two decades, almost twice that of the broader benchmark.” This return probably doesn’t account for trading costs and the time required for execution.

Figure. The MSCI World Momentum Index is based on MSCI World, its parent index, which includes large and mid cap stocks across 23 Developed Markets (DM) countries*. It is designed to reflect the performance of an equity momentum strategy by emphasizing stocks with high price momentum, while maintaining reasonably high trading liquidity, investment capacity and moderate index turnover.
However, Asness, Moskowitz, & Pedersen (2013) illustrated that it may be possible to actively trade a momentum strategy without the need for full-time trading and research. Using U.S. data from the NYSE between 1991-2010, the study found that a simplified momentum strategy outperformed the benchmark even after accounting for transaction costs. The same research found that “the optimal momentum trading frequency ranges from bi-yearly to monthly”—a surprisingly reasonable pace.
Aggressive momentum traders may also use short selling as a way to boost their returns. This technique allows an investor to profit from a drop in an asset’s price. For example, the short seller-believing a security will fall in price- borrows 50 shares totaling Rs.100 and immediately sells those for Rs.100 and then waits for the asset to drop. When it does, he repurchases the 50 shares (so they can be returned to the lender) at, let’s say, Rs.25. Therefore, the short seller gained Rs.75. The problem with this strategy is that there is an unlimited downside risk. In normal investing, the downside risk is the total value of your investment. If you invest Rs.100, the most you can lose is Rs.100. However, with short selling, your maximum possible loss is limitless. In the scenario above, for example, if the stock doesn’t drop as expected. Instead, it goes up. (In our context; SEBON and NEPSE are on the way to start sort selling option in Nepalese stock market too).
Conclusions
Momentum has historically been a great strategy. Although counter-intuitive to many value investors, buying stocks with rising prices has been a great investment approach–arguably better than value investing. Moreover, the approach is robust between the 2 samples analyzed. The lesson is clear: Let your winners ride and cut your losers short.
References:
- Asness, C.S., Moskowitz, T., and Pedersen, L. (2013). Value and Momentum Everywhere. Journal of Finance, 68(3), 929-985.
- Dhankar, R. S. (2019). Capital Markets and Investment Decision Making. Springer Nature India Private Limited, India.(https://doi.org/10.1007/978-81-322-3748-8_14)
- Jegadeesh, N., & Titman, S. (1993). Returns to buying winners and selling losers: Implications for stock market efficiency. The Journal of Finance, 48(1), 65–91.
- Jegadeesh, N., & Titman, S. (2001). Profitability of momentum strategies: An evaluation of alternative explanations. The Journal of Finance, 56(2), 699–720.
0 Comments