
AMOS is statistical software and it stands for analysis of a moment structures. AMOS is an added SPSS module, and is specially used for Structural Equation Modeling (SEM), Path Analysis, and Confirmatory Factor Analysis (CFA). It is also known as analysis of covariance or causal modeling software. AMOS is a visual program for SEM. In AMOS, we can draw models graphically using simple drawing tools. AMOS quickly performs the computations for SEM and displays the results.
In the calculation of SEM coefficients, AMOS uses the following methods:
- Maximum likelihood
- Unweighted least squares
- Generalized least squares
- Browne’s asymptotically distribution-free criterion
- Scale-free least squares
First, we have to run AMOS. By clicking the “start” menu and selecting the “AMOS graphic” option, we can run the program. The moment AMOS starts running, a window appears called the “AMOS graphic.” In this window, we can manually draw our SEM model.
- Attaching Data: By selecting a file name from the data file option, we can attach data in AMOS for SEM Analysis. This option also appears if we will click on the “select data” icon.
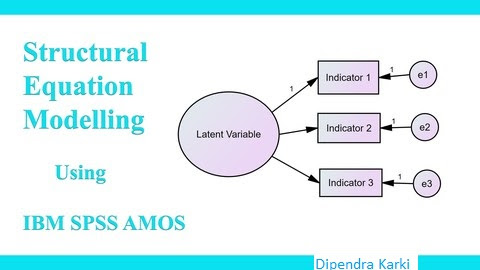
- Observed Variable: A rectangle icon is used to draw the observed variable.
- Unobserved Variable: A circle icon is used to draw the unobserved variable.
- Cause Effect Relationship: A single headed arrow in AMOS is used to draw the cause effect relationship between the observed and unobserved variables.
- Covariance: A double headed arrow is used to draw the covariance between variables.
- Error Term: In AMOS, the error term icon is next to the unobserved variable icon, and it is used to draw the latent variable.
- Naming the Variable: When we right click on a variable in a graphical window, the first option, “object properties,” is used to give the name of the variable in AMOS.
There are other icons as well, and these icons help in drawing the SEM model graphically. Icons such as erase icon, moving icon, calculate icon, view text, analysis properties, etc., help in drawing the SEM model graphically.
Understanding the text output in AMOS
After running the analysis, we can see the results on the graphic window. We can also see the text output. The graphic window will only show the standardized and unstandrized regressions and error term weights. All results will be shown in the text output.
AMOS will produce the following important output:
- Variable Summary: In AMOS and its text output variable summary, we can see how many variables and which variables are used for SEM analysis. We can see how many observed variables and how many unobserved variables were in the model.
- Accessing the Normality: In SEM model, data should be normally distributed. AMOS will give the text output, and Skewness, Kurtosis and Mahalanobis d-squared test will tell us about the normality of the data.
- Estimates: In AMOS text output, the estimate option will give the result for regression weight, standardized loading for factor, residual, correlation, covariance, direct effect, indirect effect, total effect, etc.
- Modification Index: In AMOS text output, the modification index result shows the reliability of the path drawn in the SEM model. If MI index value is large, then we can add more paths to the SEM model.
- Model Fit: In AMOS text output, model fit option will give the result for goodness of fit model statistics. It will show all the goodness of fit indexes, such as GFI, RMR, TLI, BIC, RMSER, etc.
- Error Message: If there is any problem, during the process of drawing the model (for example, if we forget to draw the error term or if we draw the covariance between two variables, or if missing data is present), then AMOS will either not calculate the result or it will give an error message.
0 Comments